stressMap a Node.js App
stressMap a Node.js App
Graduate school can be very stressful so for our node.js app assignment some classmates and I decided to build a stress map. Two buttons one red for stressed and one blue for not stressed when pressed create a visualization on a webpage that represented the cumulative stress of the people in the program.
Four of us worked on this project to accomplish the steps needed
How to Make a Node App
The Hardware
- Raspberry Pi 3 - The Raspberry Pi will act as our server. It will run the app and communicate with the browser.
- Arduino Uno - We used an Arduino Uno to drive our buttons. The Arduino has more inputs and outputs than the Pi, making it ideal to drive our buttons.
Below is a sketch on how we set up our hardware.

Frameworks & Libraries
Matt Isola and I worked on building the app.
- Node.js - Creates a server from which the app can run.
- Express.js - We used it to create the website.
- Johnny-Five - Allows for communication between the Raspberry Pi and Arduino.
- Web Sockets (Sockets.io) - Allows for communication between the client (browser) and the server. Also allows interaction from multiple browsers simultaneously.
You can see all of our code here.
The App is comprised of several parts.
- An App.js file that consists of the Johnny-Five and Web Sockets code.
- Johnny-Five allows for communication between the Pi and the Arduino. When a button is pressed Johnny-Five relays that information back to the Pi and vice versa.
- Web Sockets allows for communication between the browser and the Pi and allows for multiple users to be logged in and for their actions are seen across all users.
Currently, we do not allow for browser side interactivity so Web Sockets simply let’s the browser know when a button has been pressed. - Express was used to create our webpage. We used Express to create a pug template. This allows us to easily update the web content in the future. It also allows us to have clean URL’s. Currently, we are not using Express to it’s full extent but wanted to get it set up for future iterations.
This diagram is a visual representation of how it all fits together.

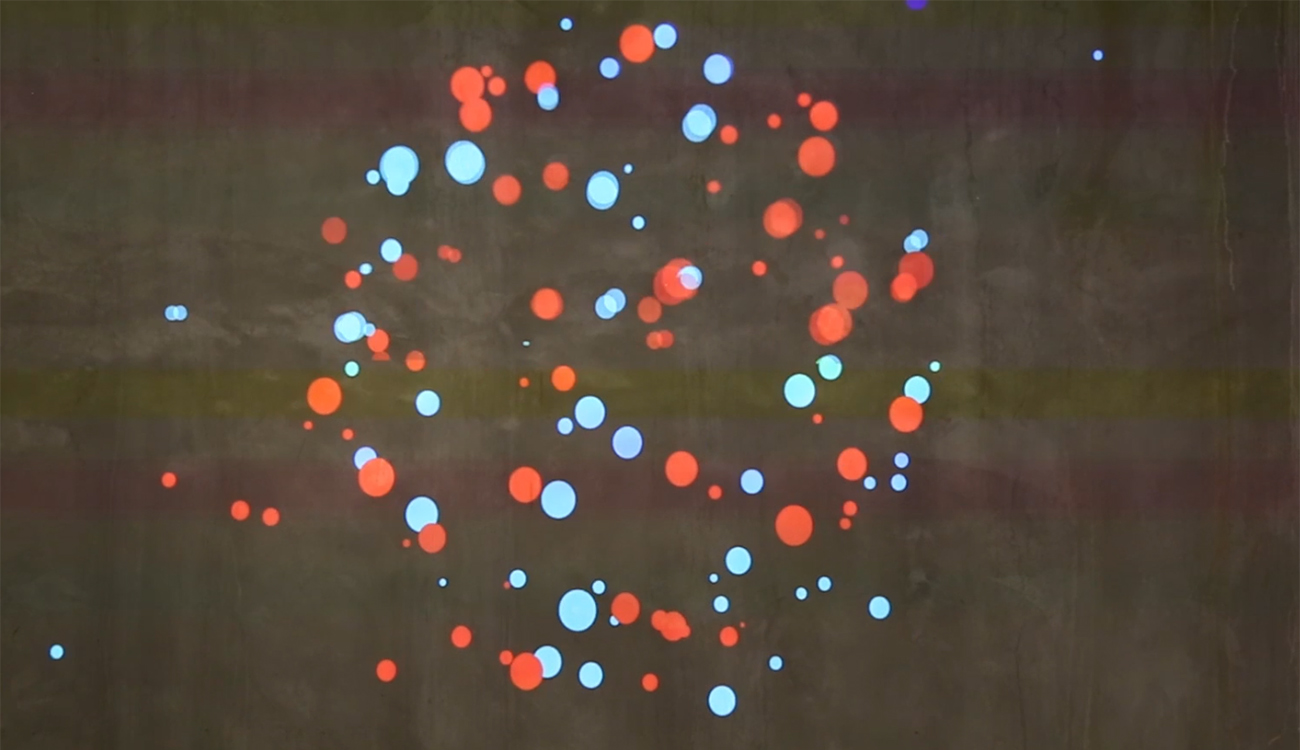
p5.js Sketch: The Visualization
The visualization of the button input was developed by Meredith Fong and Sara Safranski using p5.js, a javascript library that allows for Processing like sketches to be deployed on the web.
This captivating sketch does an amazing job capturing the levels of stress in a visually stunning way. For more information on how they did it, visit their sites above.
Integrating the Sketch
The only addition Matt and I needed to make to the sketch was to include some Web Sockets code. This connected the sketch to the Pi and through Johnny-Five, connected the sketch to the physical buttons. The result is when you push a button, the sketch responds. See the end result below.
The Result
stressMap from Jim Murphy on Vimeo.
Next Steps
- We would like to add interactivity on the sites
- Move the hardware to a more permanent build
- Deploy the App to a server
- Deploy app to a Magic Mirror platform